Creator Studio Analytics
What is Creator Studio Analytics and who is it built for?
Creator Studio Analytics is a set of dashboards built for the Moveworks bot owners and the leadership of employee services or enterprise architecture. These dashboards offer visibility into the how Creator Studio is being used, by both developers and employees. They answer the following questions:
- Which use cases have been built on Creator Studio?
- Which enterprise systems or applications have been connected? Which ones can benefit from more Creator Studio use cases?
- Are the use cases functional and effective?
- Do the use cases contribute to a great employee experience?
- Are the use cases being used by employees?
- What does employee adoption look like across departments, languages, locations and countries? At which employee group should I target efforts to promote certain use cases?
Where can I find and how can I access Creator Studio Analytics?
All customers who have activated Creator Studio have access to Creator Studio Analytics.
- Click on the App Switcher (𓃑) in the top right
- Click on Moveworks Analytics
- Select the tab for the use cases that you want to view (Paths, Queries, or Events)
How should I use Creator Studio Analytics?
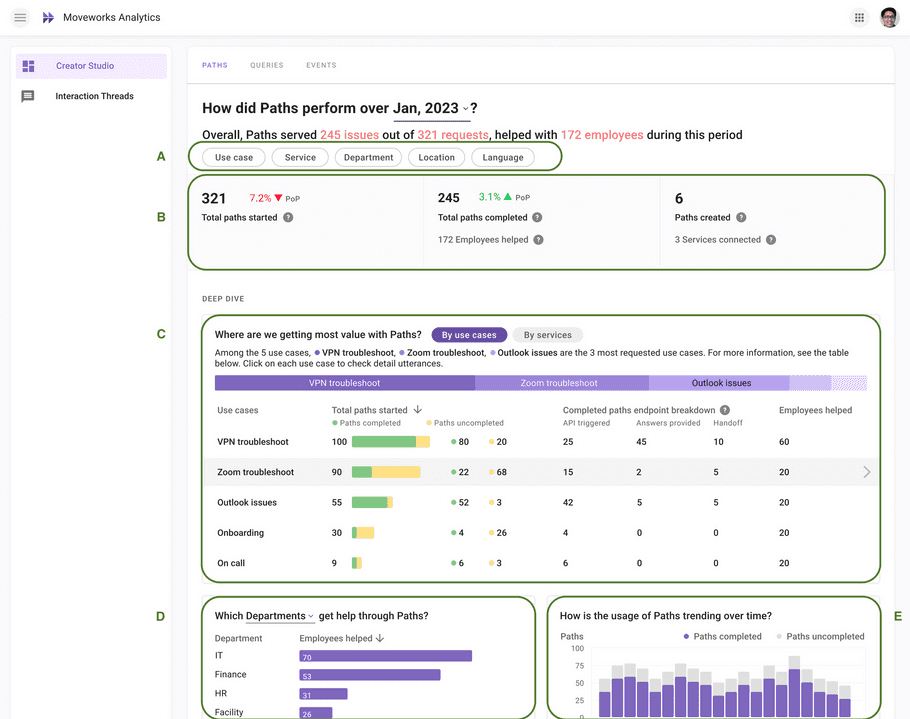
The dashboards for Paths, Queries and Events workspaces are structured in a similar way. On the analytics dashboard of each workspace, the main components correspond to the takeaways we hope you derive from the dashboard.

A. Filters
Data Update Frequency
Data for these dashboards are updated once a day. Our SLA is 4pm the following day.
- There are top-level filters that apply to the entire page. You can filter by use case, system, department, location, and language
B. Key metrics
- The key metrics paint a picture of the overall developer and end-user activity of the particular workspace. They tell you about the total number of use cases built, the depth of integration with other enterprise applications, and the overall volume of usage.
C. Breakdown of usage and effectiveness by use cases
- The center table breaks down usage, effectiveness, and employee adoption by each use case. They can inform you which use cases are having a great impact, and which ones need more attention and effort.
D. Breakdown of employee adoption by relevant attributes
- Since each use case serves particular employee personas, this breakdown by employee attributes shows you whether there is meaningful uptake by the target employee persona, whether more promotional efforts are needed, and whether there are other employee groups finding value. You can filter by the use case near the top of the dashboard to examine adoption per use case.
E. Trends of usage and effectiveness
- The trend chart provides a time perspective on the uptake of all the use cases as a whole, or whichever use case you filter by.